BlueSky Forecast Verification - Methodology
There are three main parts to the verification webpage: maps, statistics, and individual station traces. The data used in each section varies slightly, as described below.
Information on accessing verification archives is at the bottom of the page.
Verification Map
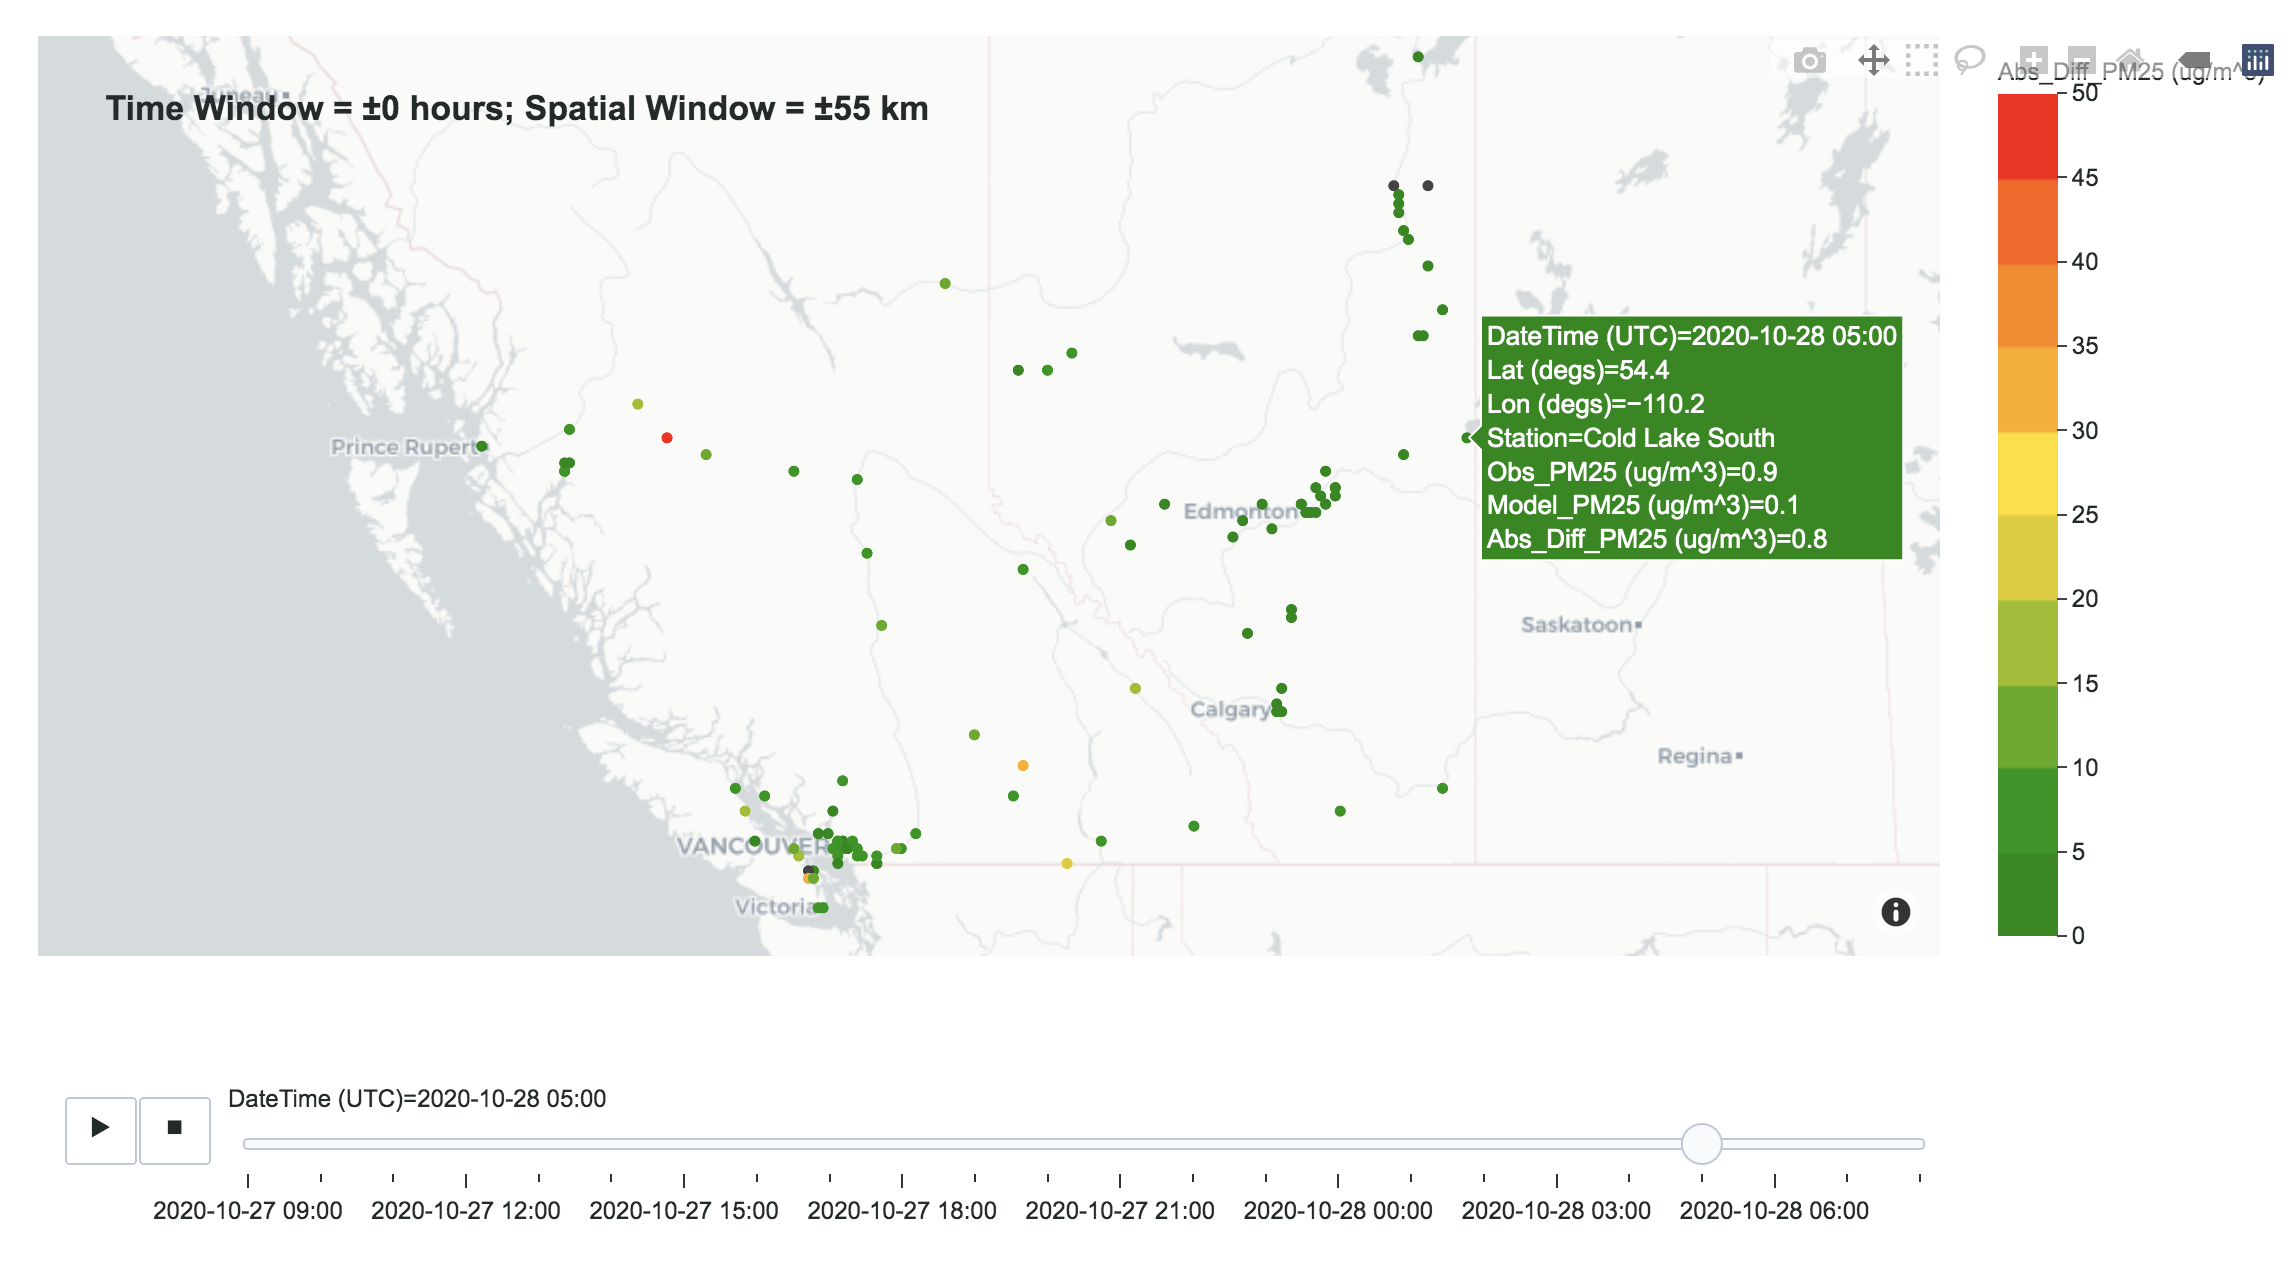
The animated map (Fig. 1) displays the absolute difference between the PM2.5 forecast and observations for many monitoring stations in Western Canada, for the first full day of the selected BlueSky forecast (default is yesterday's forecast). The colour scale indicates the magnitude of the difference: green implies a good forecast, while red is poor. The stations are filtered to display only operational and non-mobile locations. Missing observations from the remaining stations are displayed with grey dots.
Hovering over a particular station location will display the metadata and other information for that station:
- valid datetime (UTC);
- latitude (degs);
- longitude (degs);
- station name and instrument if available;
- observed PM2.5 value (μg/m^3);
- modelled PM2.5 value (μg/m^3);
- the absolute difference value (μg/m^3).
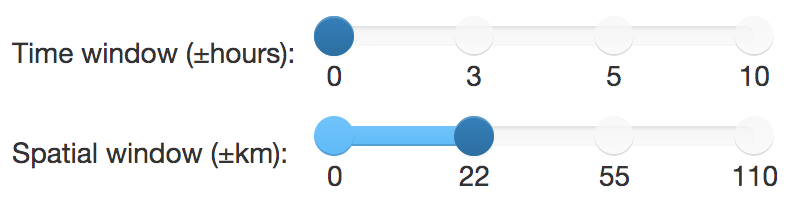
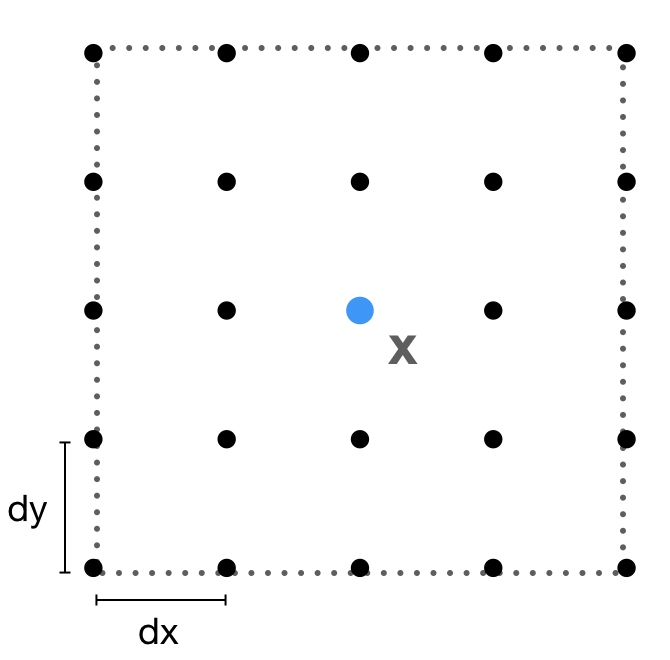
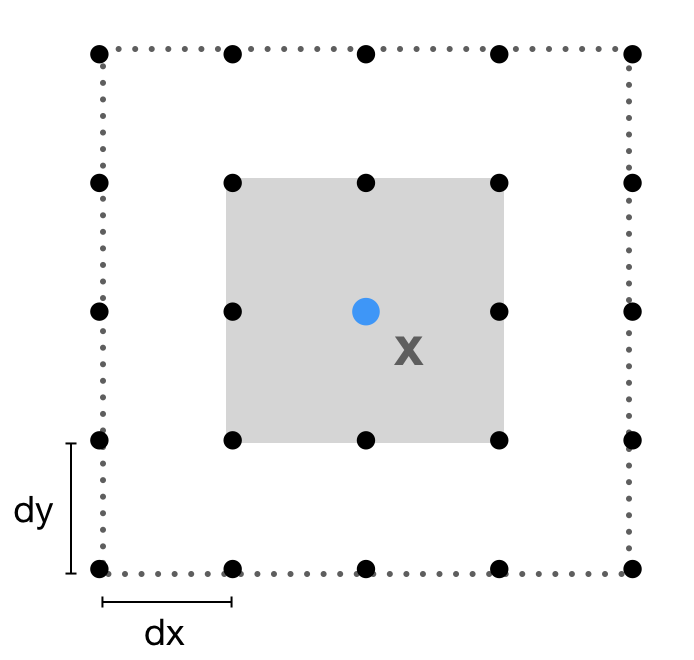
Varying the "Time window" and "Spatial window" sliders (Fig. 2) will determine the period of time and distance in space in the model grid surrounding the observation points that is used in the calculation for the absolute difference. An example with a time window of 0 hours and a spatial window of ~22 km (0.2 degs) is given in Fig. 3. For an observation location (X in Fig. 3), the nearest neighbour (closest BlueSky model grid point; blue dot in Fig. 3) is used as the centre of the grid that grows with the spatial window. From this 2-D spatial array (5 x 5 grid points in Fig. 3), the model value closest to the observation value is found. If the user also increases the time window, this array would become 3-dimensional.
Hysplit (the smoke dispersion model used in BlueSky) has a lat/lon grid with the grid spacing set to 0.1 degrees, meaning the chosen spatial windows are approximately sized as follows:
- 0 grid points, nearest neighbour to observation point is used;
- ±2 grid points = 0.2 deg ≈ 22 km;
- ±5 grid points = 0.5 deg ≈ 55 km;
- ±10 grid points = 1 deg ≈ 110 km.
The map is useful for highlighting how well BlueSky is performing for particular regions, stations, or times throughout the forecast. As the spatial and time windows get larger, the absolute difference is usually smaller, implying that the forecast successfully predicted a smoke plume within the selected windows. The maps are created using the “plotly express” package, an interactive graphing tool in Python.
Verification Statistics
We calculate 5 statistical metrics, currently for BC, AB, and zones within each province (Fig. 4): mean absolute error, root-mean-squared error, accuracy, hit rate, and false alarm rate. To account for observed background smoke, we subtract 10 μg/m^3 from the observations (observations’ = observations − 10 μg/m^3). The value of 10 μg/m^3 is based on a previous study of 41 Alberta stations where the mean background PM2.5 was found to range between 5 μg/m^3 and 11 μg/m^3 (Howard, 2015).
The mean absolute error (MAE) and root mean squared errors (RMSE) are computed using the “sklearn.metrics” (scientific python kit) package in python, using the following formulas:
$$ MAE = \frac{1}{n} \sum_{i=1}^n |f - o| ,$$and
$$ RMSE = \sqrt \frac{ \sum_{i=1}^n (f - o)^2}{n} ,$$where n = number of data points (displayed on each figure), f = forecast value, and o = observed value.
To calculate accuracy, hit rate, and false alarm rate, we create a contingency table:
| Forecast Contingency Table | observation' > 0 μg/m^3 | ||
|---|---|---|---|
| Yes | No | ||
| forecast > 1 μg/m^3 | Yes | Hits | False Alarms |
| No | Misses | Correct Negatives |
We consider real smoke occurrence, i.e., smoke is observed, where observation' > 0 μg/m^3. For forecast smoke occurrence, we consider forecast values greater than 1 μg/^3, to eliminate small numerical and truncation errors in the BlueSky model.
We use the numbers from this table in the following formulas:
- Accuracy = fraction of forecasts that were correct overall = [(hits + correct negatives)/total];
- Hit Rate = fraction of observed "yes" events that were correctly forecast = [hits/(hits + misses)];
- False Alarm Rate = fraction of "yes" forecast results that were forecast when there was no smoke observed = [false alarms/(hits + false alarms)].
Accuracy and hit rate closer to 1, and false alarm rate closer to 0, indicate a better forecast.
Individual Station Traces
The individual station traces display PM2.5 observations (red line) and the BlueSky smoke forecast + background PM2.5 value (blue line) for each station in BC and AB. To account for background PM2.5 smoke in this section of the webpage, 10 μg/m^3 is added to the forecast data, since the data is not being used in any calculation and the true observation is then visible to users. The observations are obtained from Provincial Health Ministry websites/databases.
We use a 9-point grid point average interpolation scheme (Fig. 5) to extract point forecast values for each location. First, the nearest neighbour to the observation station point is found, then a 3 x 3 array of grid points is created around it (grey shaded box in Fig. 5), and the average of these nine grid points is calculated.
The traces are useful for viewing a particular station and to monitor the true observations. Hovering over a data point will display the variable, station name, datetime (UTC), and PM2.5 value (μg/m^3). The plots are created with plotly, an interactive graphing tool in python.
References
Howard and Stull, 2015: BlueSky Canada (Smoke Forecasts from Wildland Fires for Canada): Progress Report. Submitted to NRCan, 31 January 2015. 12pp.
Verification Archives
Archived forecast verification is available for viewing, currently for October 2020, and soon for the full 2020 fire season. We do not have a searchable index yet, and are currently only verifying the BlueSky Pipeline Canada-wide 12-km 00 UTC forecast (BSC00CA12p). To access a previous forecast verification you need to type the following URL patterns into your browser's address bar:
- BSC00CA12p:
http://bluesky4.eos.ubc.ca/forecasts/verification/BSC00CA12p/YYYYMMDDHH/(using 00 UTC meteorology);
Where:
YYYYMMDD= the date of the forecast run;HH= the UTC time of the forecast run;08for Canada forecasts using 00 UTC met.