Frequently Asked Questions
General
- Where can I find a description of the system used to produce the smoke forecasts?
Please read the BlueSky Canada Wildfire Smoke Forecast System for more information.
- I can see/smell smoke outside of my window, why do I not see smoke forecasted from FireSmoke?
Our aim is to provide you with the most accurate smoke forecast as possible. Unfortunately, there are several factors beyond our control that limits our ability to provide real time (24/7) forecasts. The most notable factor is how wildland fires are detected. Almost all wildland fires are detected/monitored by satellite observation. While satellites observe a very large area, they have some of their own drawbacks. A key drawbacks results from the satellite's orbit around the earth. The satellites used by our program (see the technical section for more details) pass over a specific area once a day. As a result, if a fire starts after the satellites passes over your area, or significantly expands unexpectedly after the satellite passes, that information will not be in our forecast until the following day. Another issue which effects accurate satellite observations is the presence of clouds. They limit our ability to see the fire and its associated heat signature
We are developing new techniques to address these issues and hope to be able to provide more accurate real time forecasts in the future.
- Why are there differences between the fires displayed on the smoke forecast and the provincial wildfire status maps?
If there is a hotspot missing from the smoke forecast but it's still shown on a provincial wildfire map, it is likely because the fire has become less active and/or cloud cover has increased to the point where the satellites can not detect the fire. To compensate for this we incorporate ground reports from provincial fire agencies into our fire data reconciliation stream when they are available, but this data is sometimes not as up-to-date as we'd like.
If there is a hotspot showing on the smoke forecast map but it's missing from the provincial wildfire map, it is likely a non-wildfire satellite detect (such as a structure fire, brush fire, or transient industrial activity). Satellite detects from continuous industrial activity such as incinerators, refineries, etc are filtered from the fire data that we use in the smoke forecasts.
Note: You can use the NASA/USFS FIRMS tool to compare the satellite hotspot detects used in our smoke forecasts with the active fires reported by the provincal fire agencies.
- What time is displayed on the forecast map, and when are smoke forecasts ready?
- What is the unit of measure used in the smoke forecasts?
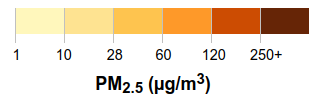
The unit of measure for our smoke forecasts is "micrograms of PM2.5 per cubic meter (µg/m³)" at ground level. PM2.5 (particulate matter 2.5) is fine inhalable particles that are 2.5 micrometers and smaller. PM2.5 poses the highest risk to health from smoke, and the Canadian Council of Ministers of the Environment (CCME) in their most recent air quality report has set the following standards for exposure to this carcinogen:
- 27 µg/m³ (daily average),
- 8.8 µg/m³ (annual mean).
Here is the scale we use on our forecast maps to show the levels of PM2.5:
References:
- How can I look at the smoke forecast for a specific location?
The easiest method is to use the interactive viewer in your browser to zoom and pan the forecast to a specific region and location. You can also download the dispersion.kmz file for a forecast and load it into Google Earth on your own computer; look for the download link on the Information pane of the forecast map sidebar or visit our Data page..
- How can I compare the smoke forecast to PM2.5 monitoring data?
We do not currently have time-series PM2.5 forecast data for a given location available through the forecast map. However, we do make the raw data available for download if you want to do your own comparison; look for the dispersion.nc download link on the Information pane of the forecast map sidebar or visit our Data page.
Visit UNBC's AQMap to see hourly PM2.5 observations from air quality monitoring stations across Canada.
- How can I compare PM2.5 and AQHI?
The Environment Canada Air Quality Health Index (AQHI) is a dimensionless number used to communicate the health risk associated with specific levels of air pollution to the general public. The BlueSky Canada system only models the emission and dispersion of PM2.5 from wildfires. AQHI is derived from a system that models atmospheric chemistry as well as particulate emissions. So, in addition to PM2.5, AQHI takes into account the levels of PM10, nitrogen dioxide and ozone. For this reason, the PM2.5 forecast and the AQHI cannot be compared directly. However, if the concentration of PM2.5 is very high, the chances are good that the AQHI will be high as well.
Visit Environment Canada's AQHI page for the most recent values.
References:
All forecasts are produced using UTC time, and the local time set on your device is the default datetime shown on the forecast map. However, you can switch it to UTC time by clicking on the datetime displayed in the Animation Control on the map.
During the Canadian fire season (April - October) our forecasts are published four times per day, every six hours. Data acquisition delays, the number of fires that the modelling system must process, and other factors may extend the time required to produce a forecast. At the height of the fire season with a large number of active fires, forecasts are published on the following approximate schedule:
| UTC | Eastern | Pacific |
|---|---|---|
| 15:00 | 11:00 (11:00 am) | 08:00 (8:00 am) |
| 18:00 | 14:00 (2:00 pm) | 11:00 (11:00 am) |
| 00:00 | 20:00 (8:00 pm) | 17:00 (5:00 pm) |
| 06:00 | 02:00 (2:00 am) | 23:00 (11:00 pm) |
Note: The 15:00 UTC smoke forecast takes longer to publish because it must wait for a special, high-resolution met forecast to be produced.
Technical
- Where can I learn more details about the models and the data used in the system?
Please read the BlueSky Canada Wildfire Smoke Forecast System.
- What affects the timing of the smoke forecasts?
Smoke forecasts are the result of a coordinated process that involves multiple agencies, data flows and software models. Please read the Daily Run Schedule for an overview of this process and the steps involved. Note that many of these steps are dependent on the number of fires currently burning; publishing of smoke forecasts can vary by hours as a result.
- How can I look at the raw data for a smoke forecast?
The time series PM2.5 emissions data is available to download in the dispersion.nc file for each smoke forecast. This file is in NetCDF format, an open format for array-oriented scientific data. We recommend using either Panoply or the Integrated Data Viewer (IDV) to view the data, and most scientific computing software has libraries to work with NetCDF files.
- Why are the smoke forecast values offset by one hour between the web forecast and the NetCDF download?
The PNG images used in the Leaflet map show the time for the start of the hour that they are valid for, whereas the HYSPLIT NetCDF output is for the end of the hour; both represent the same hourly average PM2.5 values. This is an artifact of how our modelling framework produces the output images.
- May I use BlueSky Canada forecasts and/or data in my own project or website?
BlueSky Canada is a government-funded research project whose services and data are for the benefit of the Canadian public. You are welcome to build new, preferably publicly-available, services and forecast products which incorporate BSC data, but you may not sell our data or include it in another service that exists behind a paywall.
Linking to our forecasts is encouraged, but embedding of our forecast maps and products in your website is not permitted.
Please contact us at bluesky@eoas.ubc.ca if you have any questions.
- How should I credit BlueSky Canada if I use your data?
Please include attribution to the BlueSky Canada project and the firesmoke.ca website wherever you use our data. Here is an example in the form of an HTML link:
<a href="https://firesmoke.ca" title="Data supplied by BlueSky Canada">firesmoke.ca</a>
If you did not find the answer to your question here, please use our Contact page to submit your question to the BlueSky Canada team.